When it comes to determining the quality of metal-organic frameworks, different ways of measuring are available. But what makes sense? And what do we measure and ensure quality?
Metal-organic frameworks feature a structured framework of metal ions and organic linkers. The framework is ‘made of pores’ and is thus the reason for the enormous surface area found in MOFs. Some metal-organic frameworks fall into the category of nanomaterials – particles below 100 nm. The applications of MOFs vary broadly. From adsorbing molecules on the inner and outer surface, encapsulating molecules in the framework, acting as molecular sieves or as catalysts and detection devices. All these features and applications require specific ways of measurement.
Then again, not every measurement is necessary for each application. If you want to want to adsorb molecules on the inner surface, the adsorption properties and the pore size are relevant (if the target molecules are too big, the MOF can’t use its full potential). The particle size but might not be of interest.
As a producer of advanced materials, it is of highest importance to us, that every product we ship is up to our quality standards and to what we have offered you as our client. In this post, we want to show how we measure MOFs and what other options we can apply to evaluate MOFs for your specific application.
Tests during MOF selection and scale-up evaluation
Every MOF we produce and send out to our clients, we characterise using XRD and BET measurements.
Crystal structure
 The crystal structure is the ‘fingerprint’ of the MOF. It allows us to match our MOFs against previously reported frameworks or against MOFs, that we have custom-synthesised for specific clients and applications. If the crystal structures match, the product is up to standards.
The XRD (X-Ray Diffraction, also XRC, X-Ray Crystallography, X-Ray Diffractogram) assesses the ‘fingerprint’ by measuring the x-ray beams, that are redirected from the materials in various directions. The x-ray beams are directed at the material at various angles to achieve a complete picture of the MOF (or any other material). Every material will redirect the beams in a very specific manner, which allows for the determination of the material.
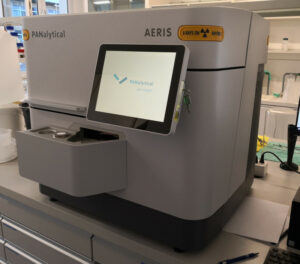
We use an AERIS XRD by Panalytical for our tests on the chrystal structure. The provided picture is of one of our HKUST-1 samples.

This measurement allows us to understand the crystallinity, purity and crystal phases inside a sample. If the self-assembly of the MOF is unsuccessful during production, the solid product might be amorphous. We can detect easily amorphous material, when the baseline is not flat. MOFs can also crystallize into different crystal phases. For example, the MOFs called MIL-53 and MIL-101 both consist of aluminium and terephthalic acid – only the crystal structure differentiates them. With a PXRD measurement, we can identify whether we have a pure-phase crystalline material or a multiphase material.
The diffractogram gives valuable information into the crystallinity of the material. The shape of the peaks can give some qualitative information about the crystallite size. The narrower the diffraction peaks, the larger the crystallite sizes.
Porosity

The surface measurement is used to determine the purity of the tested material against previously produced samples, and literature values. If we do not reach the expected surface area, the material has not been thoroughly cleaned of solvent, starting materials or by-products from the synthesis. Ergo, we need to cleanse it again or with further measures.
To measure the surface area of a material, we use a test gas such as nitrogen (N2) or argon and collect sorption isotherms from 0 to 1 bar at -196 °C. A vial is filled with a sample of known mass and the vial is being evacuated during the test. Then a known amount of N2 is added into the sample vial and into an empty comparison vial (without any material inside except for the added nitrogen). The nitrogen molecules are adsorbed onto the sample and do not contribute to the resulting pressure within the vial. This results in a lower pressure in compared to the comparison vial. Based on this difference, the surface area of the sample can be approximated with the mathematical model called Brunauer-Emmett-Teller theory, short BET.
This multi-layer adsorption model calculates the specific surface area of the MOF in square meters per gram. From this test, we also obtain the pore size and pore volume – other features that are typical for the specific MOF.
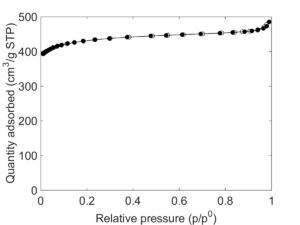
We use a Quantachrome NOVAtouch LX4 for our BET tests. The adsorption graph is from one of our HKUST-1 samples.
Application-specific tests during MOF selection
Every MOF-project has its own goal and requirements that need to be fulfilled. Thus, during the evaluation phase, we and/or you test the MOFs on different application-specific parameters.
We have seen many clients that test our materials in their own test facilities. However, we can offer a range of test methods to complement your in-house evaluation.
Available test methods:
- Synchrotron test for high resolution measurements of the crystal
Performance tests:
- Adsorption tests with other test gases
- Cycle tests
- Catalytic activity
- Breakthrough measurements
- Thermal stability
- Mechanical stability
- Stability in various gaseous and liquid media
With these tests, we can evaluate MOFs for most applications. For more extensive tests, we rely on a network of external partners. This could include tests on toxicity or specialised application.
Quality control during scale-up and ongoing production
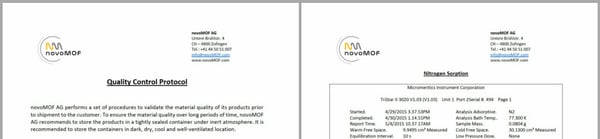 Our highest priority is the quality of the MOFs we produce for our clients. Thus, we have tight quality control measures for each shipment. We regularly take samples from production through XRD and BET tests, and state how we took our measurements, eg.:
“Powder X-ray diffraction (PXRD) patterns were collected in the 4-40° 2θ range with a PANalytical AERIS diffractometer equipped with a PIXcel 1D detector, using the Cu Kα radiation. The X-ray tube was operated at 40 kV and 7.5 mA. Nitrogen sorption isotherms at 77 K were measured on a Quantachrome NOVAtouch LX4 surface area & pore size analyzer. Samples (about 100 mg) of the production batch were activated for 7 hours under reduced pressure (38 mTorr static vacuum) at 150 °C prior to analysis. The BET numbers were calculated in the range of 0.005 < p/p0 < 0.025 according the criteria defined in “Application of Consistency Criteria To Calculate BET Areas of Micro- And Mesoporous Metal−Organic Frameworks” (J. Am. Chem. Soc., 2016, 138, 215–224).”
Every shipment includes the quality certificate of the shipped materials.
Wrap-up
Metal-organic frameworks are advanced materials that need close quality control. We use different evaluation measures tailored to the various phases of a MOF project. With these test methods and standard procedures, we ensure the quality of our MOFs – during selection, evaluation and scale-up.


.jpg)